The blockchain ecosystem remains dynamic, and Ethereum (ETH) is at the forefront of that change. In sectors such as decentralized finance (DeFi) and digital art marketplaces, Ethereum’s underlying network and activity metrics are influencing infrastructure decisions and corporate strategy. For example, a fintech company may choose Ethereum as its settlement layer because of broad wallet adoption, while a game developer may integrate Ethereum-based tokens thanks to low gas fees and high throughput. Below, we dive into detailed statistics on Ethereum’s network activity, beginning with editor choice highlights and then exploring recent developments and core metrics.
Editor’s Choice
- ~1.74 million transactions per day recorded in August 2025, a new network high for Ethereum.
- Daily active wallet addresses surging past ~700,000 in early 2025, up significantly year over year.
- Average daily transactions in 2024: ~1.16 million, representing an ~11.8% rise compared to 2023.
- Active wallets creation is rising ~33 % year over year in 2025 for Ethereum.
- Ethereum’s average transaction fee dropped sharply in 2025, a report of ~84% drop, making usage more cost-effective.
- Ethereum average transactions last 24 h (Oct 26, 2025): ~1.70 million.
Recent Developments
- Ethereum reached a new daily transaction record of ~1.74 million in August 2025, surpassing previous peaks.
- Network analysts reported a sustained period where eight of ten days from late July to early August exceeded 1.7 million transactions.
- Daily active addresses have climbed, with some data showing highs near ~930,000 in July 2025.
- Creation of new wallet addresses increased ~33% YoY, with weekly new addresses hitting ~800,000-1 million in 2025.
- Average daily transactions in 2024 (~1.16 million) mark the baseline ahead of 2025’s surge.
Ethereum Staked vs Unstaked Supply
- 30.2% of Ethereum is staked, showing strong participation in the Proof-of-Stake (PoS) system.
- 69.8% remains unstaked, maintaining liquidity for DeFi, trading, and exchanges.
- The staked share signals investor confidence in network rewards and long-term security.
- The unstaked supply reflects preference for liquidity and trading flexibility.
- The 70/30 ratio highlights a balanced mix between staking participation and market fluidity in 2025.
Daily Transaction Volume on the Ethereum Network
- As of September 24, 2025, Ethereum handled ~1.598 million transactions per day.
- In August 2025, the network peaked at ~1.74 million transactions in one day.
- For large stretches of late July and early August 2025, daily transactions ranged between ~1.7 million and ~1.9 million.
- The 2024 average daily transaction count was ~1.16 million.
- On May 9, 2025, the value logged was ~1.437 million.
- At present (Oct 26, 2025), the reported transactions last 24 h: ~1.698 890 million (1.698 million).
- Compared with 2023’s lower baseline, the ~11.8% increase in daily average in 2024 illustrates upward momentum.
Number of Active Ethereum Wallets
- Daily active addresses as per YCharts: ~609,318 (recent), up from ~408,485 one year ago.
- Additional source: daily active addresses reportedly ~930,000 in July 2025.
- Weekly creation of new addresses reached ~800,000–1,000,000 in 2025, up from ~560,000–670,000 in the same week last year.
- Cumulative unique addresses reached ~335.4 million in late August 2025.
- A two-month surge saw active wallets jump ~10% in a 48-hour window, signalling renewed interest.
- The number of unique addresses grew ~19.6% year over year from ~280.35 million to ~335.4 million.
- Active wallet growth reflects both retail uptake and increased use of dApps, NFT minting, and Layer-2 access.
Ethereum Price Predictions
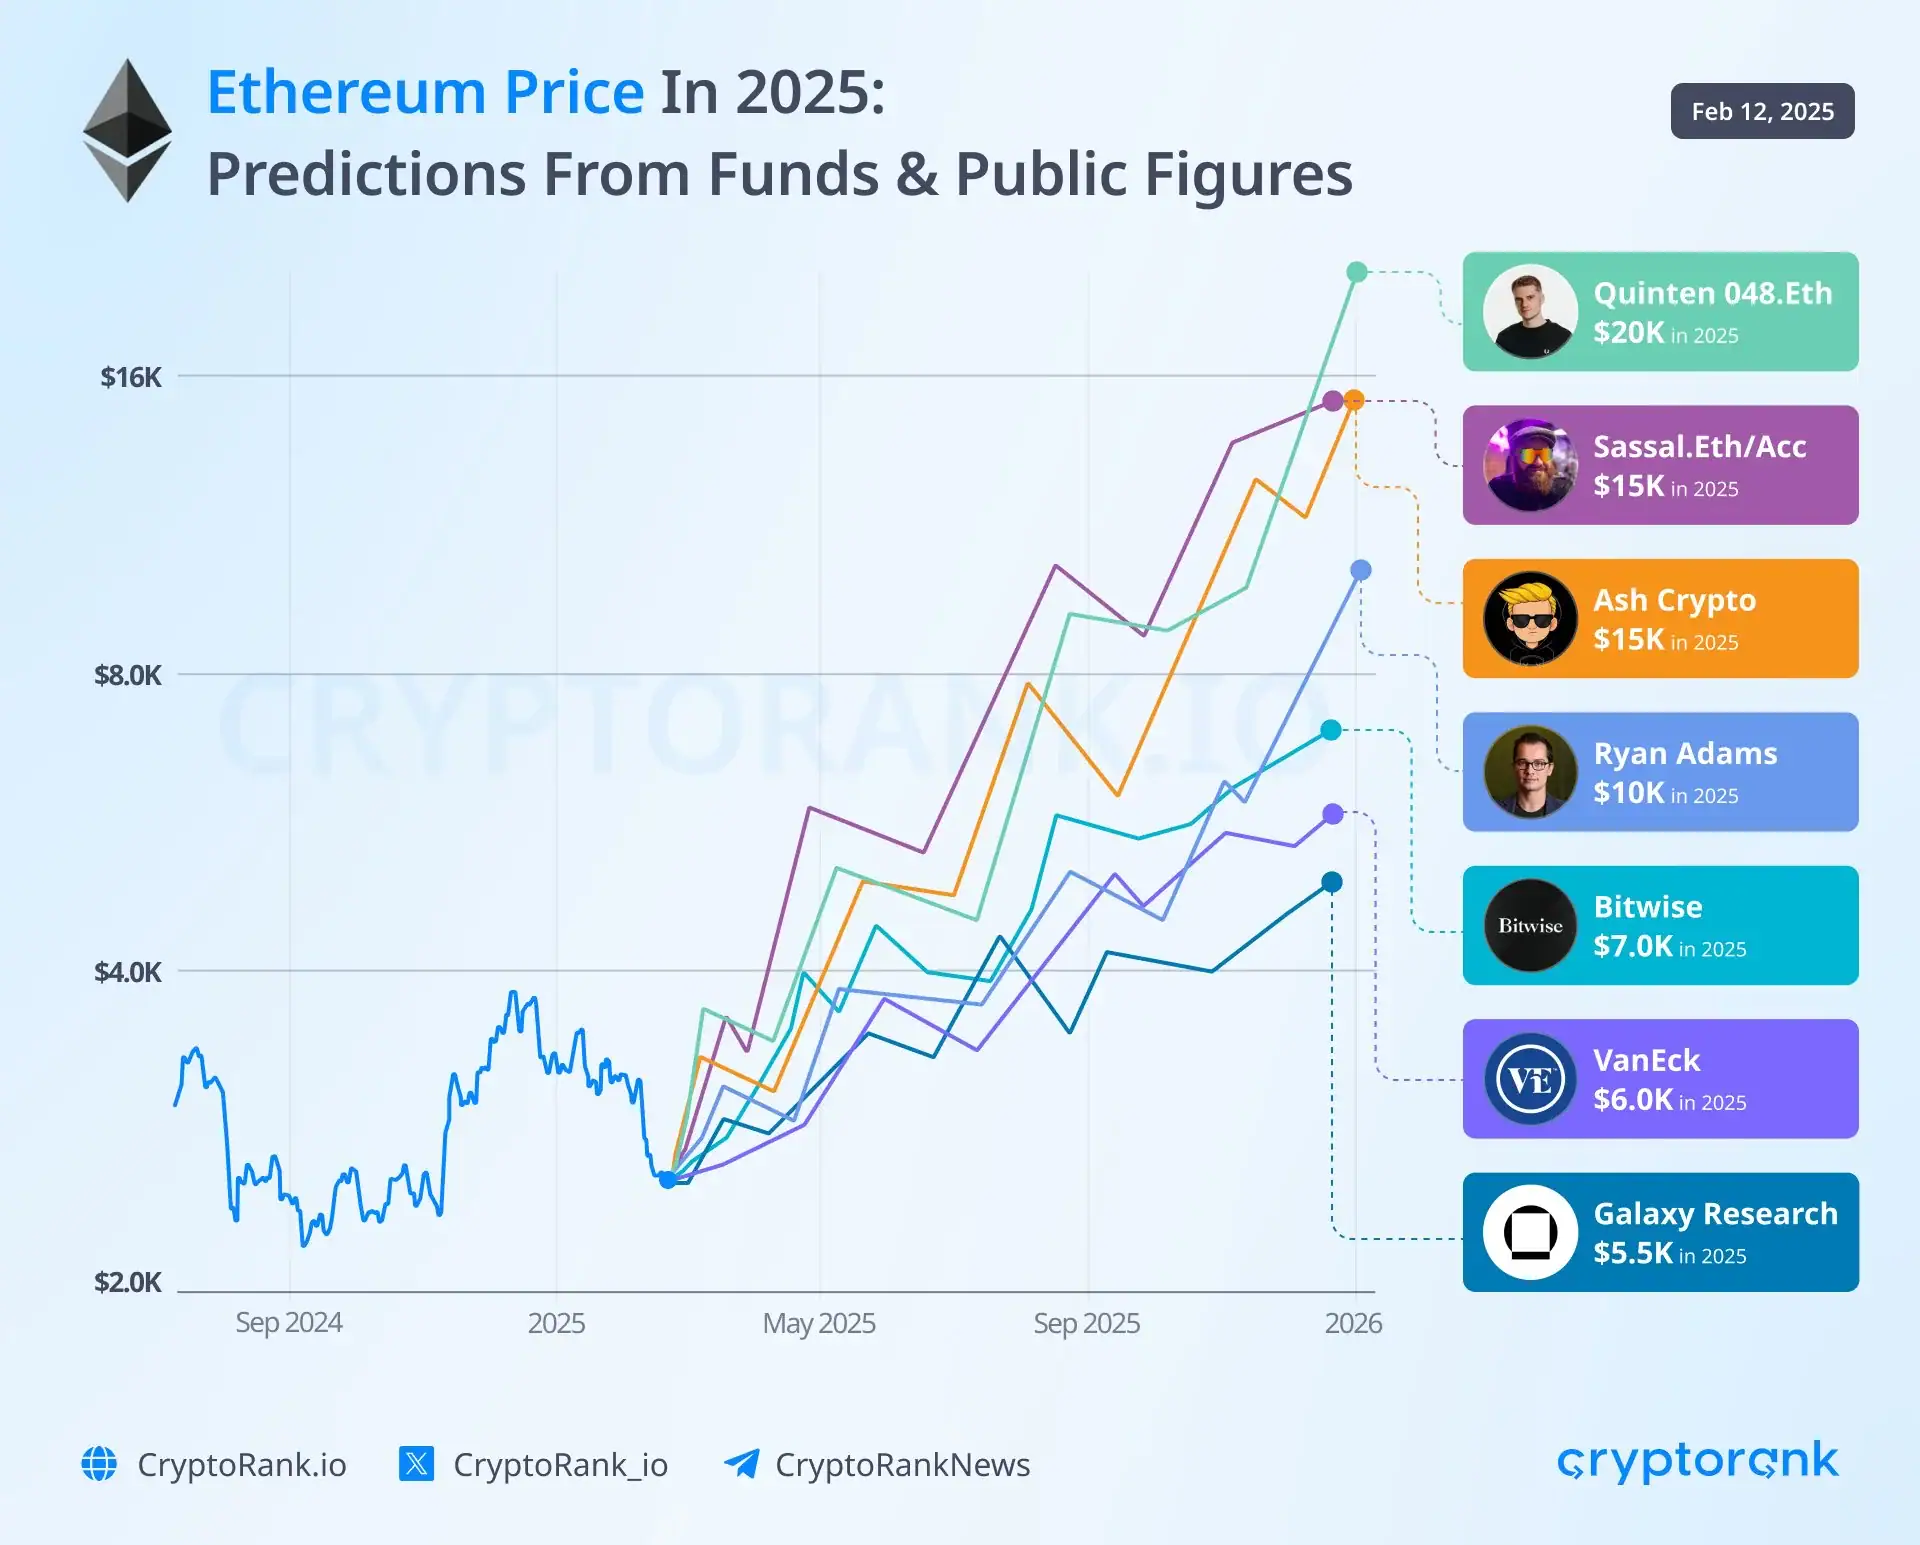
- Quinten 048.Eth gave the most bullish target, forecasting $20,000 by 2025.
- Sassal.Eth/Acc and Ash Crypto both expect ~$15,000, showing strong confidence in Ethereum’s future.
- Ryan Adams projects a moderate rise to $10,000, reflecting balanced optimism.
- Bitwise estimates a conservative $7,000, tying growth to ETF and DeFi demand.
- VanEck predicts $6,000, showing caution amid regulatory uncertainty.
- Galaxy Research gives the lowest forecast at $5,500, expecting gradual appreciation.
- Overall, 2025 predictions range from $5,500 to $20,000, highlighting diverse market expectations.

Ethereum Gas Fees Trends
- As of Oct. 24, 2025, the average transaction fee on the Ethereum network stood at ~$0.39 per transaction, down ~62% from a year ago.
- The average gas price reached 1.118 gwei on Oct. 24, which is down ~91% from ~12.64 gwei a year earlier.
- According to another tracker on Aug. 13, 2025, the average gas price was about 2.07 gwei for that date.
- Mid-2025 estimates show average gas fees around $1.85, with Layer-2 rollups enabling sub-$0.03 transactions.
- Reports state that fees dropped from an average of ~$5.90 in March 2024 to ~$3.78 by Q3 2025.
- Some sources show gas price hitting as low as ~2.7 gwei in early 2025, compared to ~72 gwei at the beginning of 2024, attributing the reduction to major upgrades.
- Network upgrade EIP-4844 (proto-danksharding) and the Dencun upgrade played a key role in making fees more predictable and lower across L1 and L2.
- While fees are low at average levels, they still spike during congestion or major dApp and NFT launches, meaning cost predictability remains an important factor for users.
DeFi Statistics (Total Value Locked & Protocol Usage)
- One estimate shows the Ethereum Layer 2 ecosystem’s TVL exceeded $43.3 billion, with L2 now handling a majority share of transactions.
- In May 2025, the protocol Aave held a ~45% market share in Ethereum DeFi, with its TVL at ~$25.41 billion.
- Monthly L1-to-L2 bridging volume reportedly hit $11.2 billion in Q1 2025, signalling strong movement of assets into rollups.
- Developer data shows that in 2025, more than 65% of new smart contracts were deployed directly on Layer 2 rather than L1.
- Swap growth: Protocols like Uniswap v4 on L2 reported ~300% growth in swap volume in one cited period of 2025.
Ethereum NFT Market Activity
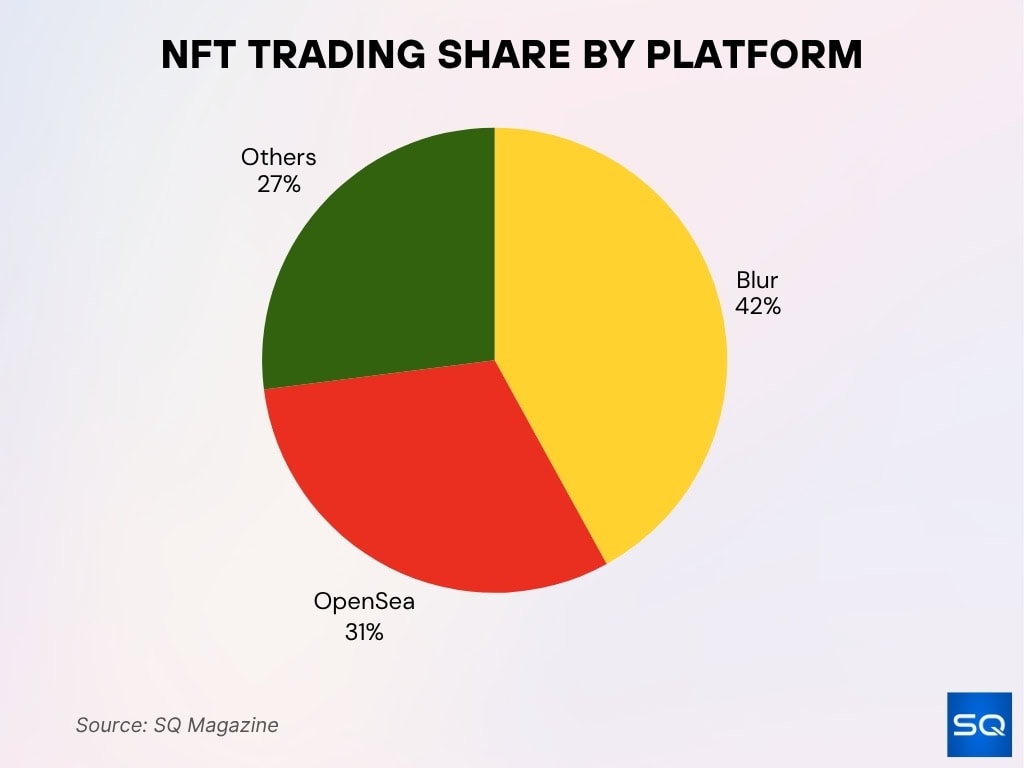
- Blur leads Ethereum NFT trading with a 42% market share, solidifying its position as the dominant marketplace driven by professional traders and high-volume collectors.
- OpenSea follows with a 31% share, maintaining strong user loyalty through its broad collection base and mainstream accessibility.
- The combined 73% control of these two platforms highlights market consolidation within Ethereum’s NFT ecosystem.
- Other platforms collectively account for the remaining 27%, indicating niche participation.
- The rising dominance of Blur reflects the growing shift toward incentive-based trading models and active liquidity in NFT markets.

Layer 2 Adoption Metrics
- In 2025, the L2 segment of Ethereum reportedly processed over 58.5% of all Ethereum transactions by one estimate.
- One report indicates L2 TVL rose 205% year over year to ~$51.5 billion, with platforms like Arbitrum (≈ 35% share) and Base leading.
- Another source states that L2 transaction fees averaged $0.08, compared with the mainnet’s average of ~$1.85.
- The L2 ecosystem’s growth is fueled by scalability improvements attributed to major upgrades on Ethereum L1 that reduce data-availability costs.
- L2 deployments are becoming primary for many dApps, and millions of wallet sign-ups were driven by L2 airdrops (e.g., ARB, OP) in early 2025.
- Some emerging L2s (zk-rollups) such as zkSync Era surpassed $4 billion TVL in 2025, demonstrating ZK-proof adoption.
- The shift to L2s is a key driver of lower fees, higher throughput, and increased user access, positioning Ethereum’s scaling narrative for mass-market adoption.
Development Activity and GitHub Commits
- Over the past 12 months, Ethereum’s ecosystem reportedly logged 28,400+ GitHub commits across core repositories.
- The number of active developers exceeded 31,869 in 2025, up from ~29,600 in 2024.
- Monthly activity events for Ethereum were cited at ~2,903 in one month of 2025, surpassing the ~1,471 commits recorded for BNB Chain in the same period.
- The developer grants the Ethereum Foundation reportedly distributed ~$32.6 million in grants in Q1 2025, up ~63% from Q4 2024 $11.6 million.
- EIPs submitted in 2025 numbered more than 230, with 37 accepted and merged by the time of publication.
- Developer focus in 2025 shifted toward scaling and cryptography research, including efforts around blob transactions, ZK-rollups, and runtime verification.
- Tools such as Foundry and Hardhat received major upgrades during 2025, improving developer experience and reducing friction for dApp builds.
Geographic Distribution of Ethereum Nodes
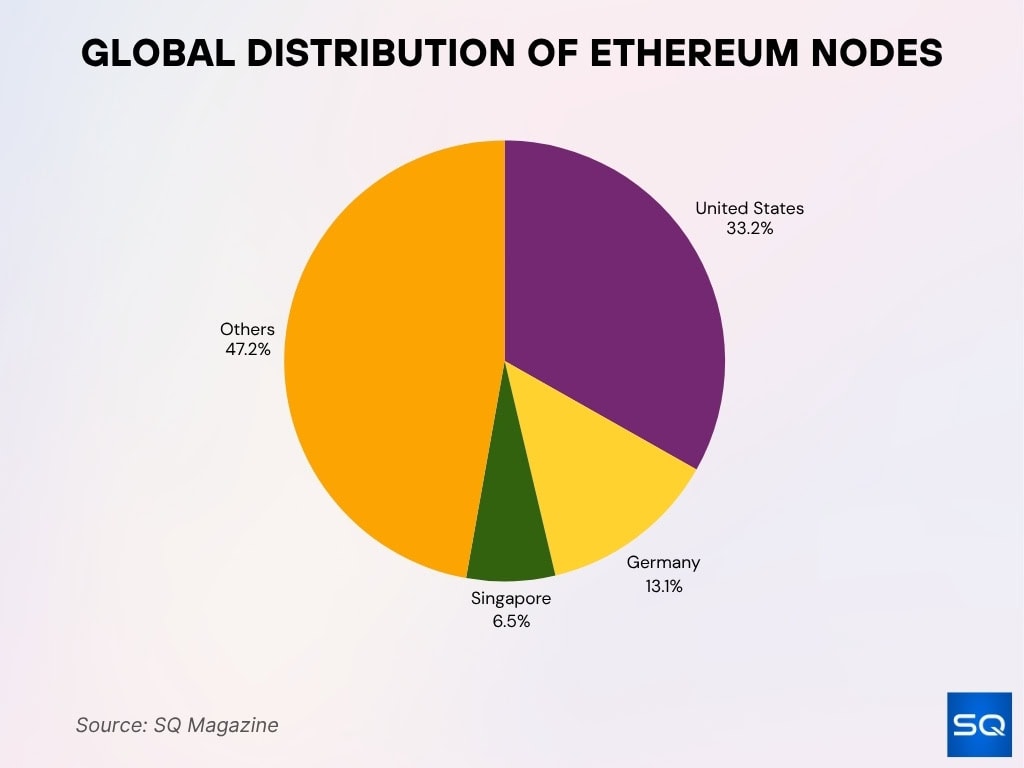
- United States hosts 33.2% of all Ethereum nodes, ranking first globally and underscoring its dominance in network decentralization.
- Germany holds 13.1%, reflecting strong European participation supported by robust infrastructure and pro-blockchain regulations.
- Singapore accounts for 6.5%, showing Asia’s growing role in Ethereum’s node ecosystem.
- Together, these three countries represent over 52% of all Ethereum nodes, emphasizing regional concentration in network operations.
- The remaining 47.2% of nodes are spread across regions, ensuring global participation.

Supply and Burn Rate since The Merge
- As of October 2025, the circulating supply of Ethereum (ETH) is approximately 120.70 million tokens.
- Since the Merge, analyses suggest a net supply decrease of around 332,000 ETH by March 2025.
- The annualized burn rate associated with the fee-burn mechanism (via EIP-1559) is around 1.32% per year.
- During Q1 2025, the network burned approximately 47,200 ETH while issuing around 232,200 ETH, resulting in an inflationary quarter of roughly 185,000 ETH.
- Major users contributing to the burn include transactions via Uniswap, OpenSea, and Tether (USDT) flows.
- Despite the burn mechanism, some reports show the net supply growth rate was around 0.801% annually as of April 2024.
- Daily burn-volume peaks during high network activity periods can exceed 10,000 ETH per day, although typical rates are lower.
- Analysts note that the deflationary effect is strongly correlated with network usage; when activity drops, burn falls, and issuance may dominate.
- Some observers argue that ETH’s “ultrasound money” narrative is valid only when burn exceeds issuance, given recent quarters, this remains inconsistent.
Security and Network Incidents
- In H1 2025, the network behind Ethereum saw 121 recorded security incidents with estimated losses of about $2.37 billion.
- A report found that 81 attacks on Ethereum in the first half of 2025 caused approximately $1.739 billion in losses, about 81.3% of all chain-related losses in that period.
- Smart-contract and bridge vulnerabilities remain major sources of loss, phishing and wallet drainers contributed hundreds of millions in losses alone.
- One of the largest single thefts involved around 401,347 ETH (~$1.5 billion) stolen from exchange Bybit in early 2025.
- The cost per incident of crypto phishing in H1 2025 averaged around $4.88 million.
- Nine incidents in H1 2025 resulted in successful asset freezes or recoveries, out of ~$1.73 billion stolen, about ~$270 million (~11.4%) were frozen or returned.
- The prevalence of security events has increased; for example, total value stolen by mid-July 2025 exceeded $2.17 billion, already surpassing full-year 2024 levels.
- While the network remains robust in processing transactions, security remains a material risk for applications built atop Ethereum.
Trading Volume and Exchange Data
- Daily average trading volume across major cryptocurrencies dropped from ~$30 billion in Q4 2024 to ~$24.4 billion in Q1 2025.
- In 2025, decentralized exchanges (DEXs) noted ~$412 billion monthly trading volume, with Ethereum-based DEXs capturing approximately 87% of that volume.
- Spot ETH ETFs recorded net inflows of $10.04 billion in Q3 2025.
- On-chain data show 24h transaction volume (for the Ethereum network) around 1.62 million transactions per day.
- NFT trading on Ethereum generated $5.8 billion in Q1 2025, a 21% YoY increase.
- Over 4.3 million NFT transactions were processed on Ethereum in the first quarter of 2025.
- Average NFT sale price on Ethereum in Q1 2025 reached ~$624 (vs ~$531 a year earlier).
- Active DeFi users on Ethereum exceeded 7.8 million, a ~19% increase year-over-year.
Energy Consumption and Environmental Impact
- After the transition to proof-of-stake, Ethereum’s energy consumption per transaction dropped to as little as 20–35 Wh (0.02–0.03 kWh).
- Comparative estimates show a >99.9% reduction in energy use relative to the proof-of-work era.
- The annualized energy footprint of Ethereum is estimated at ~0.01 TWh, comparable to the usage of a small country like Gibraltar.
- Under the old PoW model, Ethereum transactions may have consumed as much as ~84 kWh per transaction.
- The dramatic drop in energy use now positions Ethereum among the most energy-efficient major networks.
- While emissions data are less frequently updated, carbon footprint estimates align with the steep energy decline.
- Adoption of Ethereum by institutional and infrastructure players increasingly cites environmental efficiency as a factor.
- Future upgrades like proto-danksharding are expected to further reduce energy per unit of data, amplifying scalability and efficiency gains.
Staking Pool Statistics
- In September 2025, total ETH staked was estimated between 35 million and 37 million ETH, representing ~29–31% of total supply.
- At the start of 2025 (~January), staked ETH stood near 34 million ETH and rose to ~35.3 million by June.
- Liquid staking derivatives (LSDs) represent ~31.1% of all staked ETH (~10.53 million ETH) in 2025.
- Centralised exchanges (CEXs) hold ~24.0% of staked ETH (~8.13 million ETH).
- Institutional staking pools and servers account for ~17.7% (~5.98 million ETH) of the staking market.
- Solo stakers form a relatively small segment (~0.5% or ~0.18 million ETH).
- Average staking yield in 2025 is around ~2.5% annually, according to staking-services commentary.
- Growth in staking reflects growing institutional infrastructure and regulatory clarity for ETH-based products.
Comparison with Bitcoin and Other Layer 1 Blockchains
- Ethereum’s circulating supply is dynamic (~120.7 million ETH in Oct 2025) versus Bitcoin’s fixed cap of 21 million coins.
- Ethereum’s burn and issuance dynamics allow for potential deflation; Bitcoin’s supply schedule is fixed and predictable.
- Ethereum’s network scalability and Layer 2 adoption give it higher throughput potential than many Layer 1s; however, newer chains may offer lower fees in certain contexts.
- Energy consumption per transaction, Ethereum (post-Merge) at ~20–35 Wh vs numerous older PoW blockchains at much higher levels.
- In staking participation, Ethereum shows ~29–31% of supply staked, whereas Bitcoin has no native staking model, reflecting differing consensus designs.
Frequently Asked Questions (FAQs)
~547,588 addresses, up ~23.3% compared with one year ago (~444,135).
~54.2% TVL market share.
~60% of daily transaction volume processed on L2s, with ~1.74 million transactions/day.
~50.46% utilization, slightly up from ~50.42% a year ago.
Conclusion
The data for Ethereum paint a network in evolution. From its circulating supply and burn dynamics to staking participation, energy consumption, and ecosystem security, Ethereum is now far more than just a cryptocurrency; it functions as a digital infrastructure platform. The burn vs issuance dynamics hint at deflationary potential, but recent quarters emphasise that this outcome is not guaranteed. Security incidents remain a notable risk, even as trading volumes, adoption, and Layer 2 uptake continue to scale.
With lower fees, dramatically reduced energy use, and increasing institutional participation, Ethereum is positioning itself for broader adoption. That said, ongoing vigilance around supply mechanics, network incidents, and ecosystem competition remains essential. We invite you to explore the full article to gain deeper insight into how Ethereum’s metrics compare to past years and where the network is headed next.


